Walk the floor of any plant that has just installed a vision system and you will usually hear one of two stories. In the first, the system paid for itself before the next budget cycle, and the quality team would not give it back. In the second, it works exactly as advertised and nobody can quite say what it was for.
The technology in both cases is the same. What differs is the problem it was pointed at – and that, more than the model or the cameras, is what sets the return.
Computer vision in manufacturing does not have a single ROI. It has a range, from payback measured in months to a project that never clears its own cost, and where your line falls is decided long before anyone picks hardware. It comes down to the economics of the operation: how fast the line runs, what a defect costs once it has escaped, and whether inspection is genuinely holding throughput back. This guide works through that decision – including the cases where the right answer is to leave manual inspection alone.
The ROI Equation – and Why Most Plants Get It Wrong
The formula itself is trivial:
ROI = (annual benefits – annual costs) / total investment x 100%
Payback = total investment / annual net benefits
The math is easy. The inputs are where plants go wrong, because most internal business cases count one benefit stream – inspection labor – and stop there.
Labor is the stream finance can verify without argument. It is also usually not the biggest one. Across the deployments we have run, the savings come from three places, and the ordering matters:
1
Inspection labor
The visible cost. Real, but bounded – and the one every vendor already quantifies for you.
2
Throughput recovered
When inspection is the slowest step, it caps the whole line. Remove the cap and the constraint moves somewhere the business can absorb.
3
Defect escape cost
The compounding one. A defect caught at inspection costs roughly 1x to fix, at rework about 10x, and at a customer claim or recall 100x. This is usually where the largest number hides.
The quality profession has a name for that last multiplier. The Rule of Ten – also called the 1-10-100 rule – is a long-standing rule of thumb rather than a measured constant: it estimates the cost at roughly $1 to prevent a defect, $10 to catch and fix it internally, and $100 once it reaches the customer. Treat the exact multipliers as illustrative, but the direction is consistent with how warranty and recall costs behave. The same economics underpins ASQ’s cost-of-quality framework, which puts quality-related spend at 15-20% of sales revenue for a typical manufacturer.
The Two Conditions That Decide Almost Everything
Strip away the vendor slideware and the decision comes down to two questions about your line, not your technology.
A
Is inspection a throughput constraint?
If one-minute manual inspection sits inside a cycle time that matters, it is not just a labor line – it is a ceiling on output. A vision cell running at seconds per part does not only change inspection cost; it changes the throughput math for the entire line. If inspection is not on the critical path, automating it saves labor and little else.
B
Are escaped defects expensive?
The higher your product value, and the further downstream a defect travels before it is caught, the more the Rule of Ten works in favor of detecting at source. If a defect becomes a warranty claim, a recall, or a safety incident, reducing the escape rate is worth far more than the inspection hours you save.
The manual-inspection baseline you are improving against is worse than most quality teams assume. A Sandia National Laboratories study of precision-manufactured parts, published in the journal Human Factors (See, 2015), found inspectors correctly rejected only 85% of defective parts – while incorrectly rejecting 35% of acceptable ones, with performance holding roughly steady regardless of experience, vision, or training. Against the industry average for visual inspection of around 80% cited in the same research, that is the ceiling you are starting from.
When both conditions are true, the three savings compound. When only one is true, the case gets thinner and payback stretches. When neither is true, computer vision can still be technically impressive and still be a poor investment.
The two conditions are multiplicative, not additive. A high-volume line with cheap, harmless defects gets labor and throughput savings. A low-volume line making expensive, safety-critical parts gets escape savings. A line with both gets all three at once – which is why ROI is not a spectrum but a cliff. The plants that fall off the wrong side of it are not buying worse technology; they are pointing good technology at the wrong problem.
Where the Money Actually Comes From
Here is each value stream in plain terms, so you can test which ones apply to your line before you talk to anyone.
Labor
A line running 1,000 units per shift with one-minute manual inspection spends roughly 17 person-hours per shift inspecting. At 2.2 seconds per part, that drops to under 40 minutes. On a tight labor market – where quality inspectors carry a median pay near $47,460 a year and are hard to hire – avoided recruitment matters as much as avoided wages.
Throughput
If the line was throttled to match the inspection station, removing that station releases capacity you have already paid for. This is frequently the largest single lever – and the one most business cases omit, because it depends on demand to absorb the extra output.
Escape cost
Every defect caught before it ships avoids rework, returns, warranty, and reputational cost – and the sums are large. US-based manufacturers paid more than $30 billion in product warranty claims in 2025. At production volume, even a two-to-three percentage-point reduction in escape rate can outweigh total inspection labor.
Scrap and rework
Catching defects earlier means less material and labor are invested in parts that will ultimately be scrapped. Real-time feedback also lets you correct the process before another batch is affected.
False rejects
Manual inspection rejects a large share of perfectly good parts – in the Sandia study, 35% of acceptable ones. Every false reject costs re-inspection, handling, and sometimes scrap. A well-tuned model with configurable sensitivity cuts that waste.
Quality data
Manual inspection leaves no structured record. Automated inspection logs defect type, location, time, line, and batch – which feeds supplier conversations and process fixes that manual inspection simply cannot support. It is a different class of value, and it is often why deployments keep paying back after the initial investment is recovered.
When Computer Vision ROI Is Highest
These are the four situations where the two conditions line up and the numbers tend to look strongest. The pattern is not industry-specific – it is the same logic whether you make seats, flooring, food, or electronics.
| Production environment | ROI potential | Primary driver |
|---|---|---|
| High volume, inspection is a bottleneck | Maximum | Unlocks line speed; scales without headcount. |
| High-value or safety-critical parts | High | Prevents 100x warranty and recall costs. |
| Regulated production (traceability required) | Moderate-high | Automated records manual inspection cannot produce. |
| Labor-constrained plants | Moderate-high | Enables output that could not otherwise be staffed. |
| Low volume, high variety | Moderate / low | High upfront labeling cost vs. manual labor. |
| Invisible or structural defects | None | Requires X-ray or ultrasound, not cameras. |
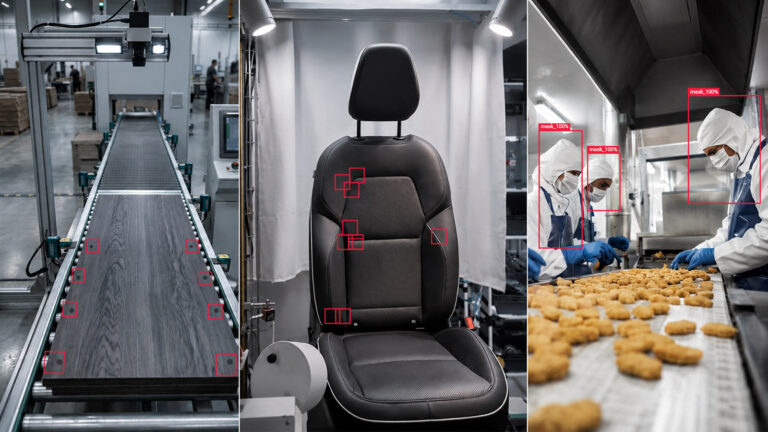
Highest: high-volume lines where inspection is a genuine constraint. The automotive seat deployment is the clearest example we can point to – thousands of units daily, inspection on the critical path, more than 40 product variants needing a consistent standard. You can read the full automotive seat defect-detection case study, and the numbers behind it in the original piece on how computer vision in manufacturing took inspection from one minute to 2.2 seconds.
High: high-value or critical parts. The more a defect costs once it escapes, the more the Rule of Ten works in your favor. This is also where the barriers to entry are highest, because the standards are non-negotiable – which is exactly why a controlled comparison of custom builds versus off-the-shelf AI QC tools tends to favor a system built for your line.
Moderate-high: regulated production and labor-constrained plants. In regulated manufacturing, the value is partly in the audit trail: every automated inspection generates a date-stamped record that manual inspection cannot match. In labor-constrained plants, the value is that the system enables output you simply could not staff. Food and pharmaceutical lines are the clearest examples of the regulated case – the ROI results from AI quality control in food manufacturing show how quickly detection gains translate into avoided recalls and compliance value.
Before you model any of this, get a baseline. Defect escape rate, false-reject rate, inspection cycle time, and cost per inspected unit are the four numbers that decide whether the project is worth doing – and most plants have never measured them.
Our guide to the AI quality control metrics that actually predict production performance walks through how to capture them, and how to test a vendor against them.
When the ROI Isn’t There
This is the section vendor content skips. It matters more than the success stories, because the most expensive mistake is a well-run project pointed at the wrong problem.
✕
Low volume, high variety
If you run 50 units a month across constantly changing configurations, the upfront work to label enough representative examples may never recover. The data cost is roughly fixed; the volume that spreads it is not there.
✕
Defects a camera cannot see
Computer vision identifies what a camera can see. If the quality problem is material density, internal integrity, or something invisible on the surface, this is the wrong tool regardless of what an accuracy benchmark claims. That is a sensor question – see our comparison of RGB, X-ray, and hyperspectral imaging.
✕
No domain expert in the loop
A system is only as good as the definition of a defect it is trained on. If the people who know which surface irregularity is unacceptable are not involved, the model learns the wrong boundary – and no amount of tuning will fix a label definition that was wrong from the start.
✕
The false-positive trap
At very high line speeds, an aggressive model that rejects good product can cost more than the defects it catches. At 300-1,200 units per minute, even a 1% false-reject rate means thousands of units per shift. Sensitivity has to be configured to the economics, not maximized for the demo.
The Costs Most Business Cases Leave Out
ROI is benefits minus costs, and the cost side is where optimism does the most damage. Getting a vision system to the point where it runs reliably is not autonomous – only running it is. The four steps below are what stood between a promising prototype and a production system in our seat deployment.
1
Domain definition
Quality experts define what a defect actually looks like across every product variant – before a single image is labeled. This is engineering time, and it cannot be short-cut by a data scientist working from a spec sheet.
2
Data labeling
In our deployment, roughly 100 hours of expert time went into tagging more than 5,000 representative images across materials, lighting conditions, and defect types. Modern architectures reduce the amount of data needed – we have trained production models on as few as 100 well-chosen photos – but the expert labeling step never disappears.
3
Integration
Connecting the vision cell to existing PLCs and MES platforms is often the step that extends timelines, especially where legacy systems are involved. Budget for it explicitly rather than treating it as an afterthought.
4
Ongoing maintenance
Models drift. Lighting changes as bulbs age. New material variants get introduced. A system at 99% on day one needs monitoring and periodic retraining to stay there. Modest relative to the savings – but leaving it out of the model produces a payback figure that will not survive contact with finance.
The rule that follows from all of this: the ROI you model internally will only be real if it includes every benefit stream and every cost stream. An honest model with the maintenance line included is far more convincing to the people who release the budget.
How to Estimate Your Own ROI Before You Talk to a Vendor
You do not need a vendor’s calculator to know roughly where you stand. Five steps, in order:
1
Measure the baseline
Current defect escape rate, false-reject rate, inspection cycle time, and cost per inspected unit. Without these, there is no ROI – only a claim.
2
Quantify all three streams
Labor hours freed, throughput recovered, and escape cost avoided. If you can only substantiate one, say so – the others are upside, not assumptions.
3
Add the hidden costs
Expert definition time, labeling, integration, and ongoing maintenance. These are the lines that turn an optimistic 3-month payback into a defensible 12-month one.
4
Assume 95-99%, not 100%
No honest model claims perfect detection at production speed. A conservative accuracy assumption is the single fastest way to make your business case credible.
5
Model five years, not two
Deployments that look marginal on a two-year horizon often look very different on a five-year one, because the second value stream – scale without headcount – only shows up over time.
A quick, honest sanity check, not a quote. It uses the three benefit streams that matter (labor, defect escape, throughput) and shows the assumptions behind every number. Change any field and the result updates instantly.
Assumptions behind this estimate (read before trusting the number)
- Escaped defects today = defective units × (1 - manual accuracy). Escaped defects after deployment = defective units × (1 - expected accuracy). The 80% manual accuracy default is a commonly cited baseline for visual inspection. Replace it with your own audit data if you have it.
- Each escaped defect is costed at the figure you enter. The real cost can be much higher once a defect reaches a warranty claim or a recall (the "Rule of Ten"), so enter this number carefully.
- Labor savings assume inspectors are redeployed or not replaced. If they are not, this stream is close to zero.
- Throughput value is specific to your operation, so it defaults to zero instead of a guess.
- The stress test halves the accuracy improvement, then cuts escape savings by 30%, labor savings by 50%, and throughput value by 50%. It is a deliberately pessimistic scenario.
- Payback = upfront investment divided by monthly net benefit. The model is simple: no discounting, no ramp-up period, and no costs beyond the running cost you enter.
These are your assumptions, not ours. Want them validated against your actual line and defect data? We will scope it properly and tell you if computer vision is the wrong call.
Book a meeting →
What Changes Over a Five-Year View
The speed and accuracy numbers are the obvious part of the business case. The structural change is harder to put in a spreadsheet, and it is usually what separates a good investment from a great one.
Manual inspection scales linearly: more volume means more inspectors. Automated inspection does not follow that curve. When a new product line is added, the vision system handles additional variants without additional inspection staff. That avoided hiring cost is invisible in most ROI models, and it compounds every year the plant grows. As one line proves out, expanding the same approach across a facility multiplies the benefit without multiplying the cost – a pattern we have seen across computer vision projects running in production today in manufacturing, agriculture, and safety monitoring.
There is a second, quieter effect. An automated system produces structured quality data – defect type, location, time, batch – that can be fed back into the process instead of sitting unrecorded. That data is what turns inspection from a cost center into a lever for continuous improvement. It is also, unglamorously, the same mechanism behind a different class of savings: when you can see idle stations, hidden downtime becomes a number you can act on, as we covered in idle workstation logging.
The honest conclusion is this: computer vision in manufacturing does not just make inspection cheaper. It decouples inspection cost from production volume – and that is a structural change in how quality scales. If you would like to know whether your line is in the high-ROI category before you commit budget, see how we approach computer vision consulting for real production environments – or take the numbers from the calculator above to us and we’ll pressure-test them against your actual line.
Frequently Asked Questions
How is computer vision ROI calculated?
ROI equals annual benefits minus annual costs, divided by total investment. Payback is total investment divided by annual net benefits. The difficulty is never the formula – it is capturing all three benefit streams (labor, throughput, escape cost) and all cost streams (including labeling, integration, and maintenance).
When is computer vision not worth it in manufacturing?
When production volume is low and product variety is high, when the defects are not visible to a camera (structural or density problems), when there is no domain expert to define the defect, or when a slow line means inspection is not a constraint. In those cases the same budget often does more elsewhere.
What payback period is realistic?
It depends almost entirely on escape cost and volume. High-value, high-volume lines have shown payback inside a year; marginal cases can run considerably longer. Any figure quoted without your defect-escape cost and throughput constraint attached is a marketing number, not a projection.
Does computer vision replace inspectors?
In practice it changes the role rather than removing it. The system handles 100% inline inspection at line speed, catching obvious defects and flagging ambiguous cases. Inspectors move from monotonous screening – where accuracy degrades – to handling exceptions and improving the process, which is both more valuable and harder to automate.
The market agrees that this technology is going mainstream – machine vision is projected to roughly double by 2030. What the market cannot tell you is whether it pays back on your line. That is a question about your volume, your escape cost, and your bottleneck – and it is worth answering before anyone opens a proposal.