Automated Quality Inspection & AI Production Planning in Hardwood Flooring - Case Study
AI SOLUTIONS  •  WOOD MANUFACTURING  •  PRODUCTION OPTIMIZATION

From Log to Lamella: Automated Quality Inspection and AI Production Planning in Hardwood Flooring

How a premium hardwood flooring manufacturer connected automated quality inspection with AI production planning to recover more value from every log, stabilise quality at line speed, and turn planning and inspection into measurable, data-driven processes.

+2.4 pts
Lumber recovery
96.7%
OTIF
100%
Inline inspection
11
Defect classes

Defect classes detected and localised on every board: knots, wormholes, scratches, splits, cracks, wane, decay, insect damage, colour deviation and machine-related surface damage.

Client
U.S.-based premium hardwood flooring manufacturer and integrated sawmiller, with around 30 years of industry experience.
Scope
Production planning and material optimization, plus inline lamella quality control.
Production chain
Log yard → primary breakdown → lamella sawing → kiln drying → grading → pressing → profiling and finishing → packaging.
Timeline
7 months to production deployment (discovery, parallel pilot and phased rollout), followed by 6 to 12 months of monitored production use to stabilise results.
Environment
Dust, vibration, variable lighting and temperature variation.
Core principle
Optimise useful, saleable output for the current order book, not raw recovery in isolation.
Client & Context

A vertically integrated operation makes every inefficiency visible

The U.S.-based client is a vertically integrated hardwood flooring manufacturer and sawmiller, managing the chain from log processing and drying through lamella production, grading, and finished engineered hardwood flooring. Vertical integration gives the company control over quality and supply, but it also means the cost of a weak decision cannot be passed upstream to a supplier. A suboptimal cut becomes lower recovery. A missed defect becomes added cost at pressing, profiling, sanding and finishing.

The client produces a 4 to 6 mm sawn hardwood wear layer, with the wood dried to approximately 7 to 9% moisture content before grading and assembly. These are the client's own process parameters for premium engineered flooring rather than universal industry standards, and they are the baseline the inspection system was calibrated against.

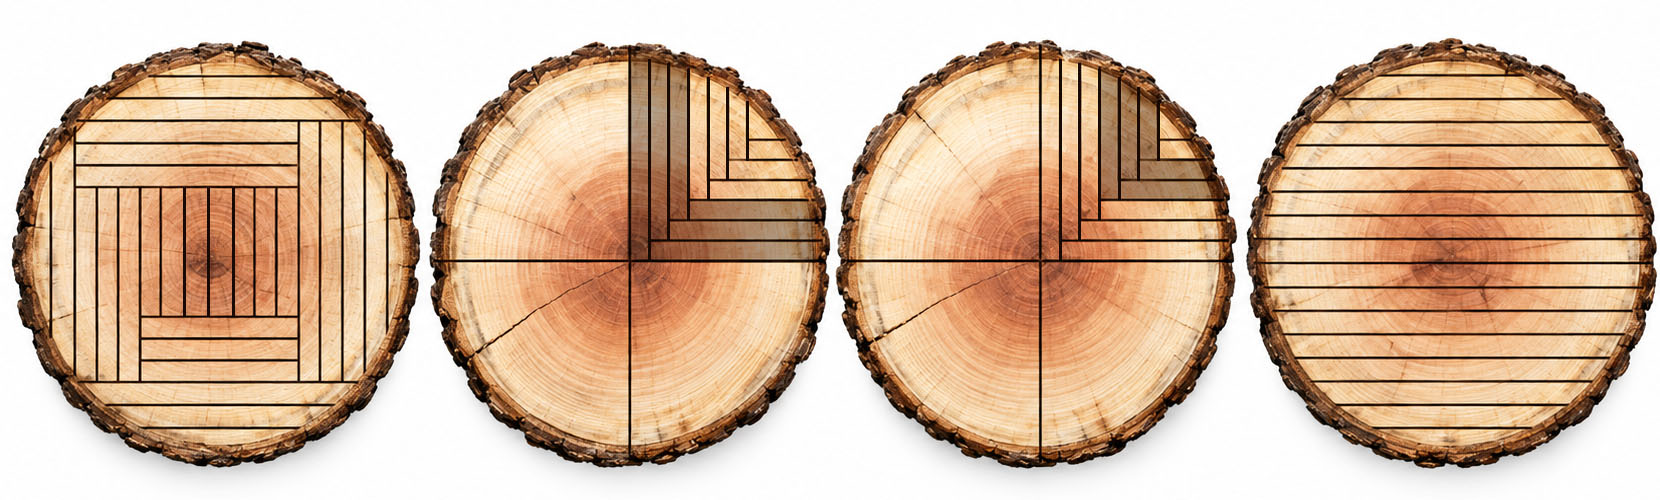
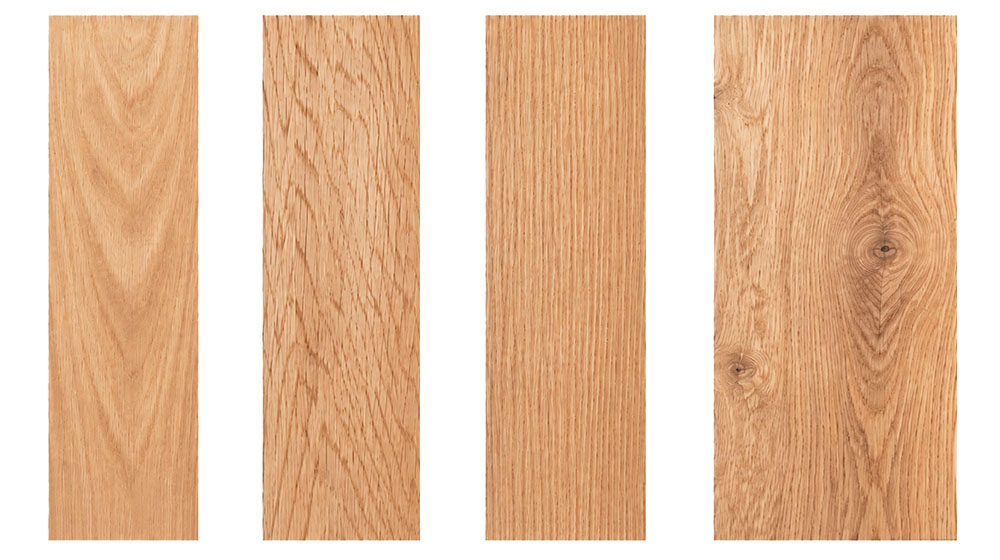
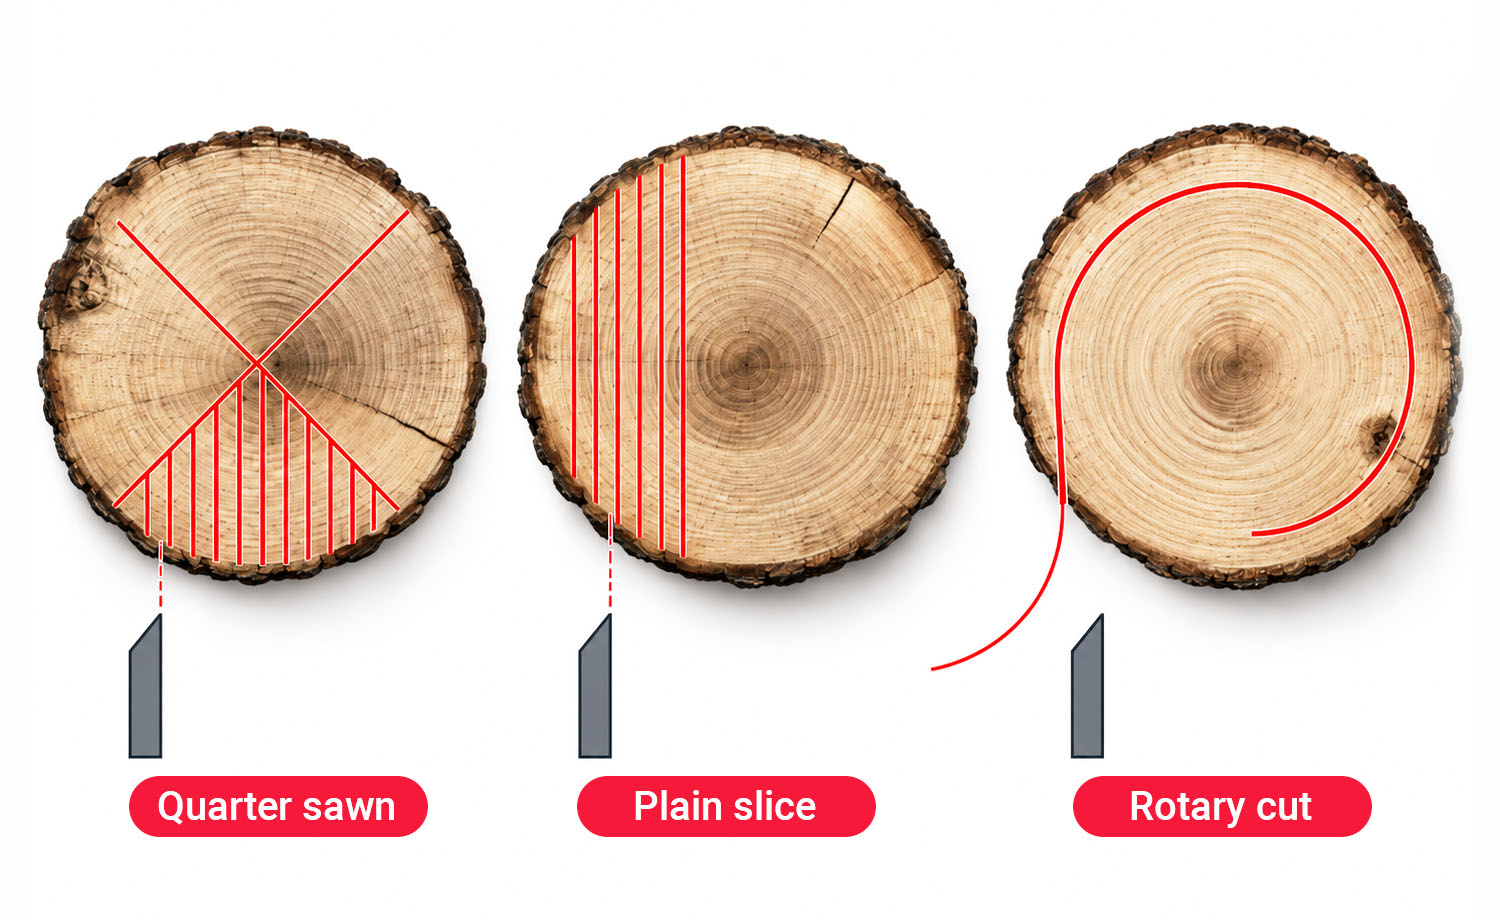
Cutting method changes both appearance and material recovery. Different breakdown patterns create different grain outcomes and different usable widths, so production optimization has to balance geometry, grade, demand and economic value rather than volume alone.

Log end-grain cross sections showing four different sawing patterns overlaid on the log face.
Breakdown patterns evaluated at the log: each defines how much usable width and which grain the order can actually be filled with.
Board samples showing the face grain and edge grain produced by each cutting pattern.
The resulting face and edge grain for each pattern. Geometry, grade and demand have to be solved together.
Quarter-sawn, plain-sliced and rotary-cut examples shown side by side.
Production-planning visual

Quarter-sawn, plain-sliced and rotary-cut examples, shown as a production-planning visual. Not every method is necessarily used by this client; they are the trade space the planner has to reason about.

The Challenge

Two ceilings: planning by experience and inspection by eyesight

Both processes worked. Neither could systematically evaluate the thousands of interacting choices that decide what a log is worth.

Challenge A

Planning and material usage

Planning had become a single-expert system. Order data, log inventory, drying schedules and shift notes lived in different places. Planning happened one shift at a time, and every disruption required a manual rebuild.

  • Daily plan creation took roughly 2 h 40 min; replanning after a disruption could take 3 h 40 min.
  • The planning horizon was effectively one shift, leaving about three viable cutting-pattern choices instead of a 7 to 14 day scenario set.
  • Seven unscheduled saw-pattern changes per week created lost time and sequencing instability.
  • Kiln fill averaged about 84%, reflecting weak visibility between today's saw schedule and the drying pipeline 5 to 10 days ahead.
  • Planning logic lived partly in one technologist's experience; replacing that expertise could take months.
Challenge B

Lamella quality control

Premium-grade lamellae move quickly, natural wood has legitimate visual variation, and defects range from structural problems to biological marks and machine damage. Human inspection creates a speed-accuracy trade-off and leaves little structured data behind.

  • Effective manual audit coverage was in the low single digits of total output.
  • Different inspectors, or the same inspector at different times, could draw the grade boundary differently.
  • Defects include knots, checks, splits, cracks, wane, decay, insect damage, colour deviations and scratches.
  • A defect that escapes grading becomes more expensive once core, glue, press time, profiling and finishing are added.
  • Manual inspection produced no per-lamella history to connect downstream rejects with upstream log class, cutting pattern or drying charge.
Manual inspection
Automated inline inspection
Coverage limited to a small sample of outputLow single-digit audit rate; no structured record left behind
Every lamella inspected100% inline coverage at production speed
Accuracy drifts with fatigue and interpretation92.4% applied at the documented standard; variance shifts with the inspector and the shift
The same boundary applied to every unit98.6% consistency against the same documented standard; inter-shift variance eliminated
Defect escape into pressing: 1.9%Cost added at every downstream step
Defect escape into pressing: 0.3%A per-lamella record of defect type, position and severity
Our Solution

One data spine, two decision engines

The program was designed as one connected system rather than two isolated automation projects. A shared data spine links log class, order, cutting pattern, lamella, grade, defect and outcome: the planner can optimise against actual production results, and the quality manager can trace recurring defects back to the conditions that created them.

Workstream A

AI production planning and material optimization

Data foundation

Log intake records, sort classes, cutting patterns, drying charges, grade outcomes, order book and delivery history were reconciled into a single planning model. Existing spreadsheets stayed valid as inputs during adoption rather than being replaced all at once. This is one plant's version of that. For the general explanation, and the seven questions that tell you whether your plant needs APS at all, read what advanced planning and scheduling is

Yield and economic objective

A yield model quantified recovery, grade mix, order coverage and changeover cost. The objective was useful, saleable output for real demand, not maximum cubic volume regardless of grade or dimensions.

Scenario search

The optimisation layer evaluates 13,000+ candidate combinations in a planning cycle and returns a small set of economically ranked plans for planner review.

Rolling horizon

Planning moved from one shift to a rolling 7 to 14 day window, letting the system treat order priorities, log inventory, kiln requirements and changeovers as one problem.

Executable plan

Approved plans are pushed into ERP, MES and WMS workflows so operators execute the chosen sequence without retyping or verbal translation.

Fast replanning

When an order, delivery or machine condition changes, the horizon is recalculated in minutes and affected orders are flagged automatically.

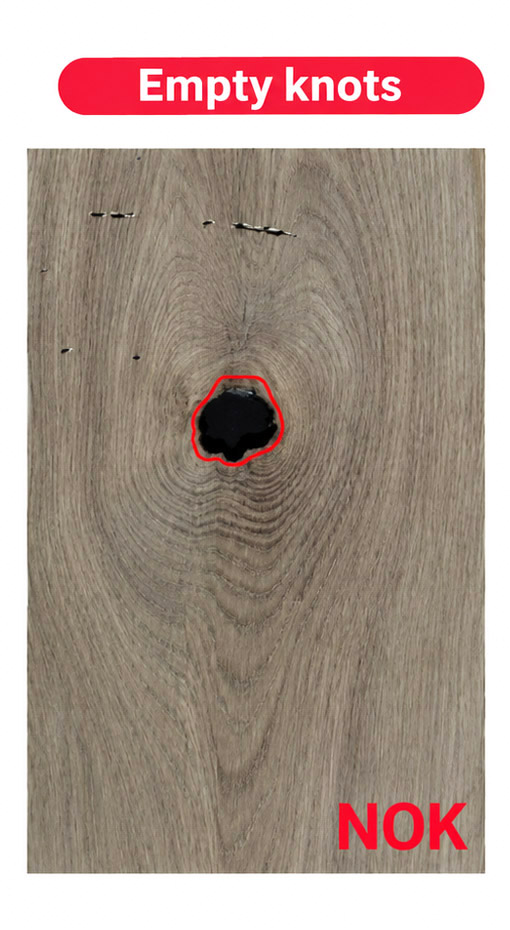
A single inspection panel showing an empty knot circled in red and marked as rejected.
One rejected lamella, as the operator sees it: the defect is circled, classified as an empty knot, and marked not-OK against the grade standard.
Workstream B

How inline automated quality inspection works

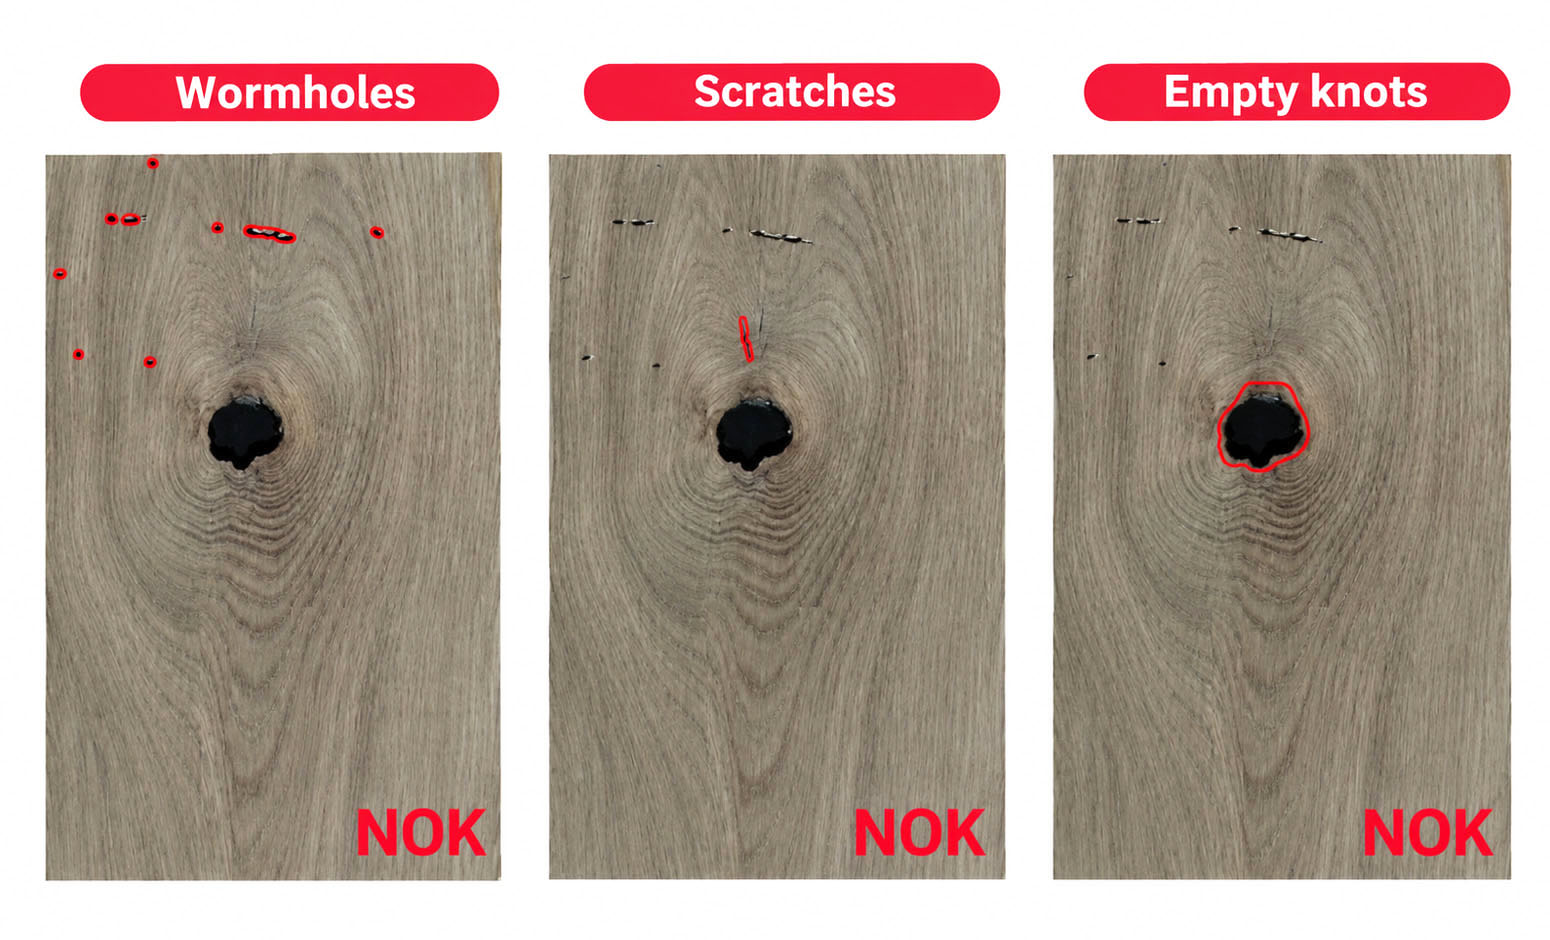
Lamella defect detection interface showing wormholes, scratches and an empty knot localised and classified against the manufacturer's grade criteria.
Automated lamella defect detection

Wormholes, scratches and empty knots are localised on the board surface and classified against the manufacturer's own quality criteria, with a pass/fail disposition recorded for every unit.

Production-line imaging

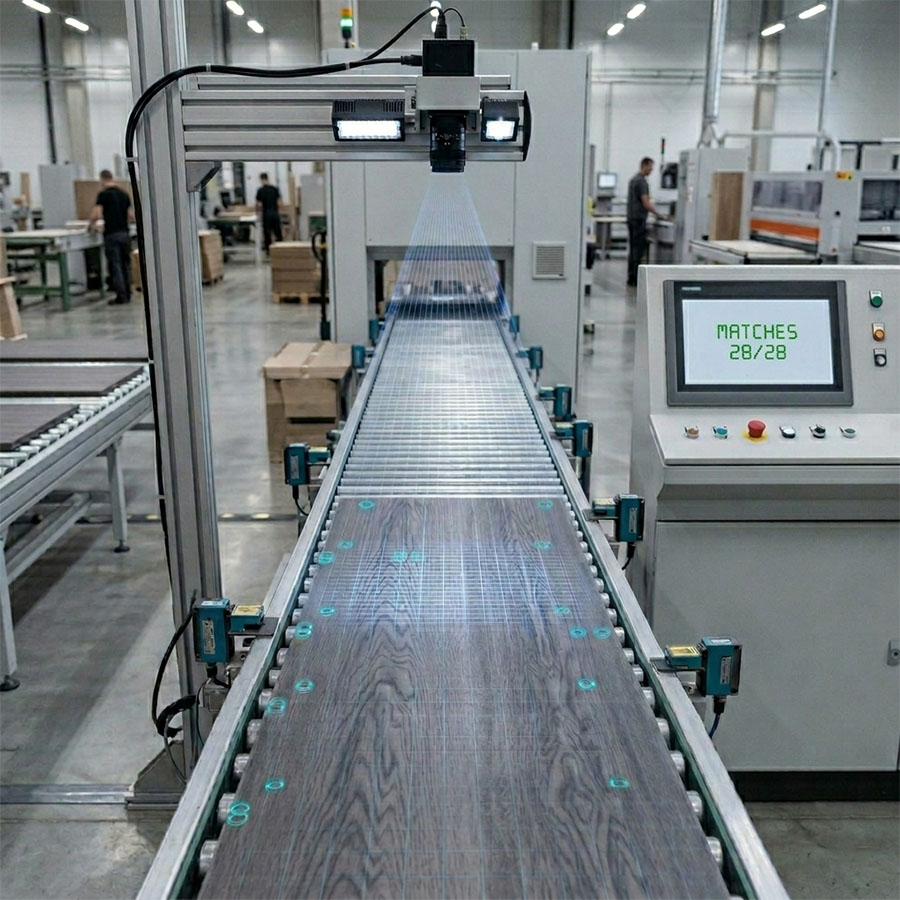
High-resolution cameras and controlled illumination were installed on the existing grading line, protected against dust, vibration and temperature variation.

Client-specific model training

Deep-learning models were trained against the client's own grade definitions, so the system learns the commercial boundary between acceptable natural character and a genuine reject.

Multi-class detection

The deployed system classifies 11 defect classes and localises each issue on the lamella surface in real time.

100% coverage

Every lamella is inspected at production speed instead of relying on sample audits or intermittent manual checks.

Structured quality data

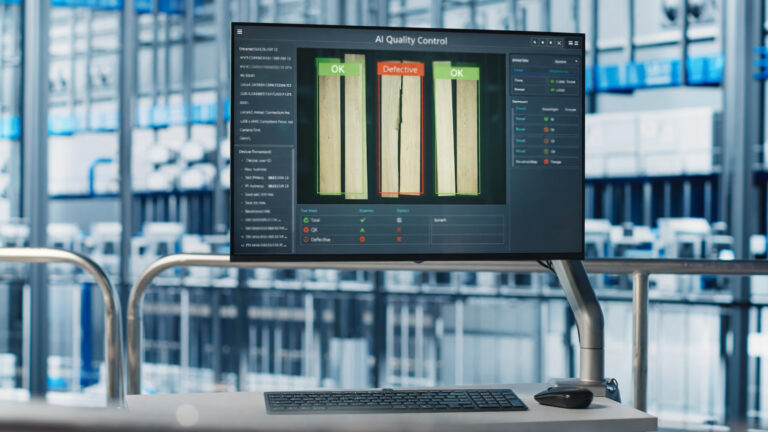
Each inspection becomes a record with defect type, position, severity and disposition, enabling trend analysis by shift, log class, cut pattern or drying charge.

Closed-loop learning

Grade recovery and defect outcomes flow back into the planning model, improving estimates of what each log class and pattern actually produces over time.

Live Detection

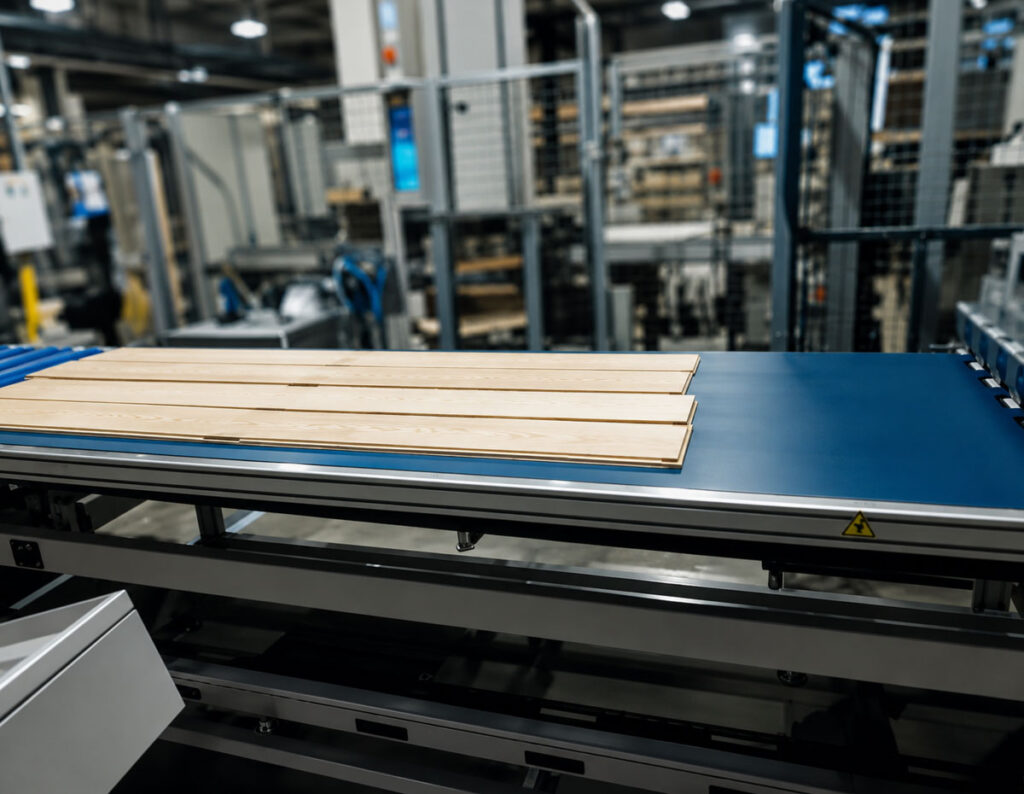
Inline inspection on the lamella line. Recorded on site during production: boards running on the line while the camera captures the surface of each one. 17 seconds, no sound.

Implementation

Seven months to production deployment, then a measured maturation period

The rollout followed a shadow-first approach: new logic was evaluated against the existing process on real orders and real production before it was allowed to make production decisions. This separates time-to-deployment from time-to-stabilised business impact.

Weeks 1 to 5

Data audit and baseline

Reconcile production and order data; define the baseline metrics; externalise the grade standard; choose one saw line, one grading line and one product family.

Weeks 6 to 16

Model build and offline validation

Calibrate the yield model on historical results; compare optimised scenarios with past planner decisions; train inspection models using live-line images; agree the integration design.

Parallel pilot

Shadow operation

Run manual and optimised plans side by side; run vision inspection in shadow mode; investigate deviations daily while the cause is still observable.

Phased cutover

Adoption and second site

Move product families and shifts onto the new workflow progressively; redefine the planner as reviewer and exception handler; promote AI grading from shadow to authority with human exception review.

Months 8 to 18

Stabilisation and measured impact

Track plan-versus-actual recovery, grade mix, OEE, kiln utilisation, OTIF and inventory over sustained production use; refine planning parameters and quality thresholds using live outcomes. Claims and returns are assessed over the longer window because they lag production.

Ongoing

Continuous improvement

Monitor drift and new operating conditions; review exception patterns; retrain or recalibrate vision models as species, grades, formats and defect examples change; update optimisation assumptions when process constraints or commercial priorities change.

Results

What changed after deployment, and what matured over time

Fast workflow metrics can be demonstrated at go-live. Recovery, grade mix, OEE, kiln utilisation, OTIF and inventory are better treated as stabilised production results measured over the following 6 to 12 months. Customer claims are a lagging indicator that needs an extended observation window.

01
At go-live
14 days

Planning horizon widens from a single shift. Plan generation, replanning speed, 100% inspection coverage and defect-class capability are all demonstrable on day one. Daily plan time: 2 h 36 min to 6 min.

02
Following 6 to 12 months
+2.4 pts

Lumber and grade recovery, OEE, kiln utilisation, OTIF, changeovers and slow-moving stock settle as operating behaviour and model parameters stabilise. Kiln fill: 84% to 94%.

03
Longer-lag impact
-44%

Customer claims and returns, and annualised financial value, which need enough shipped product and elapsed time to be meaningful. Claims: 1,340 ppm to 750 ppm.

Planning and material optimization

MetricBeforeStabilisedChange
Daily planning cycle time2 h 36 min6 min−96%
Replanning after disruption3 h 40 min11 min−95%
Planning horizon1 shift14 days rolling-
Cutting patterns evaluated313,000+ simulated-
Lumber recovery51.8%54.2%+2.4 pts
Select-grade lamella recovery38.6%41.7%+3.1 pts
Unscheduled pattern changes per week74−43%
Saw line utilisation (OEE)71.4%79.1%+7.7 pts
Kiln charge fill84%94%+10 pts
OTIF (on-time, in-full)88.4%96.7%+8.3 pts
Slow-moving finished stockindex 100index 78−22%
New planner time-to-competence~5 months6 weeks−70%

Inline lamella quality control

MetricBeforeStabilisedChange
Inspection coverage~4% sample audit100% inline-
Defect classesn/a11-
Grading accuracy vs documented standard92.4%98.6%+6.2 pts
Defect escape into pressing1.9%0.3%−1.6 pts
Inter-shift grading variancehigheliminated-
Grading headcount per shift62−67%
Customer claims and returns1,340 ppm750 ppm−44%
Defect data availablenoneper lamella-
Line speed impact-none, up to 42 m/minno slowdown

Four of the six grading roles per shift were redeployed to exception handling, process oversight and finishing-quality work rather than removed from the business.

Business Benefits

The value is not one metric: it compounds across the production chain

More saleable product from the same raw material

The 2.4-point recovery improvement means more output from the same log spend. Because raw material is the dominant cost base, even small recovery gains compound quickly.

Better grade mix, not just more volume

The model plans against order requirements and grade economics, increasing the share of select-grade lamella rather than merely maximising total volume.

Faster planning and faster recovery from disruption

Planning shifted from hours of spreadsheet work to minutes of scenario review, releasing expert time for exceptions, process improvement and commercial trade-offs.

Higher delivery reliability

A longer planning horizon coordinates saw, kiln and order priorities, reducing the amount of production that is technically busy but disconnected from what customers need.

Quality consistency at line speed

The same defect boundary is applied to every lamella, every shift, with no fatigue and no speed-accuracy compromise.

Earlier containment of defects

Rejecting a problem before pressing avoids adding core, glue, press time, profiling, sanding and finishing to material that cannot be sold at the intended grade.

A quality dataset for continuous improvement

Per-lamella records make defect patterns traceable, so production teams can move from anecdotal quality discussions to evidence by log class, pattern, drying charge and shift.

Less dependency on scarce expertise

Planning logic and grade rules become explicit system knowledge, reducing the operational risk of a single expert being unavailable and shortening onboarding time.

Modelled value

The research brief models annual value from six drivers using the client's cost structure and the stabilised operating improvements reached after deployment. It is a model built on mature performance, not a guarantee, and not a claim that every benefit was fully realised inside the seven-month implementation window.

$2.13M
Modelled annual value across six drivers
$340K
One-time working-capital release from lower slow-moving stock
Value driverBasisAnnual value
Lumber recovery+2.4 pts applied to annual log procurement$465K
Select-grade recovery+3.1 pts valued at the realised grade differential$610K
Recovered line hoursHigher utilisation, fewer unplanned changeovers$310K
Inspection labour redeployedFour roles per shift moved to higher-value work$410K
Claims and returns avoidedMaterial, freight and channel-management cost$250K
Planning overhead avoidedPlanner time and continuity-risk reduction$86K
Modelled annual valueStabilised performance across six drivers$2.13M
Why This Matters

The program turns tacit manufacturing knowledge into a scalable capability

The strongest outcome is not the dashboard or the model. It is the operating model: planners still own the production decision, but no longer spend hours calculating it; quality specialists still define the grade standard, but no longer have to inspect every lamella with human eyes. The software handles repeatable calculation and inspection so experts can own the exceptions and improve the process.

Optimise the whole chain, not one machine

A high-recovery cut that produces the wrong grade or dimension can create inventory instead of margin.

Write the quality standard before automating it

A model cannot enforce a grade boundary the organisation has never explicitly defined.

Shadow first, automate second

Parallel operation created trust and exposed model and process disagreements while they were still diagnosable.

Connect quality back to planning

Inspection data becomes far more valuable when it updates assumptions about real grade recovery by log class and cutting pattern.

FAQ

Automated quality inspection, answered

Automated quality inspection uses cameras, controlled lighting and trained models to evaluate product quality on the line instead of relying on human eyesight. In this program it means every lamella is imaged at production speed, classified across 11 defect classes, and judged against the manufacturer's own documented grade standard, producing a quality record for each unit rather than a periodic sample.
Yes. The constraint is the quality standard, not company size. This rollout started on one saw line, one grading line and one product family, and the existing spreadsheets stayed valid as inputs during adoption. The system was kept in shadow mode until it agreed with the documented standard, which limits risk and capital exposure before scaling to other lines.
This is the case automated inspection handles best when models are trained client-specifically. Deep-learning models were trained on the manufacturer's own images and grade definitions, so the system learns the commercial boundary between acceptable natural character, such as knots, colour deviation and grain variation, and a genuine reject, rather than applying a generic defect list.
Against the same documented standard, grading consistency rose from 92.4% to 98.6%, and inter-shift grading variance was eliminated because the same boundary is applied to every unit. Defect escape into pressing fell from 1.9% to 0.3%. The comparison that matters is not human versus machine eyesight, but documented standard versus inconsistent application of that standard.
Yes. Cameras and illumination were installed on the existing grading line with protection for dust, vibration and temperature variation, and line speed was unaffected, up to 42 m/min. Approved production plans are pushed into the existing ERP, MES and WMS workflows, so operators execute the chosen sequence without retyping or verbal translation.
In this program, an implementation cost of approximately $1.15M was netted against a modelled annual value of $2.13M, giving a modelled payback of about 6.5 months based on stabilised performance. That is a business-case model built on the client's cost structure after 6 to 12 months of monitored production, not a claim that every benefit was realised inside the seven-month implementation window.
Because the two decisions share the same data. Inspection produces the real grade recovery for each log class and cutting pattern, and planning needs exactly that to price a cut correctly. Treated as two separate projects, the planner keeps working from stale assumptions and the quality data stays locked in a report nobody acts on.
The planner moved from building the schedule to reviewing ranked scenarios and handling exceptions. Grading specialists moved from inspecting every board to owning the grade standard, reviewing flagged units and improving the process. Four of the six grading roles per shift moved to exception handling, process oversight and finishing-quality work rather than out of the business.