That gap – one minute to 2.2 seconds – is the inspection time difference in a deployment we ran for one of the world’s largest automotive seat manufacturers. 27x faster. 99% detection accuracy. Approximately 30x cost savings compared to manual inspection.
Those numbers are also specific to one production environment, one defect type, and one set of conditions that took months of work to create. If you’ve sat through enough computer vision vendor presentations, you’ve learned to be skeptical of clean numbers without context. That skepticism is right.
This post gives that context – what computer vision in manufacturing actually delivers, what it costs to get there, and what the business case looks like when you include the parts usually left out.
Why Manual Inspection Costs More Than Your Labor Report Shows
When a computer vision investment gets evaluated internally, the comparison usually starts with headcount. That’s not because quality leads don’t see the limitations of manual inspection – most do. It’s because headcount is the number finance can verify without argument. Everything else requires assumptions, and assumptions lose budget conversations.
The problem is that headcount captures roughly half the actual cost.
Even well-run manual inspection operations have a fundamental accuracy ceiling. While industry averages for manual visual inspection accuracy hover around 80%, a Sandia National Laboratories study published in the journal Human Factors confirms the problem runs deeper than a single accuracy number: even experienced inspectors hit only 85% on defective parts while incorrectly rejecting 35% of acceptable ones, and performance held steady regardless of inspector experience, vision, or training. Even with duplicate inspection, reaching a theoretical 96% containment still leaves a ‘leakage’ of 4 true defects for every 100 parts. And that’s before accounting for fatigue.
Accuracy drops measurably after around two hours on a shift, particularly on subtle surface defects where the difference between acceptable and defective is a matter of millimeters.
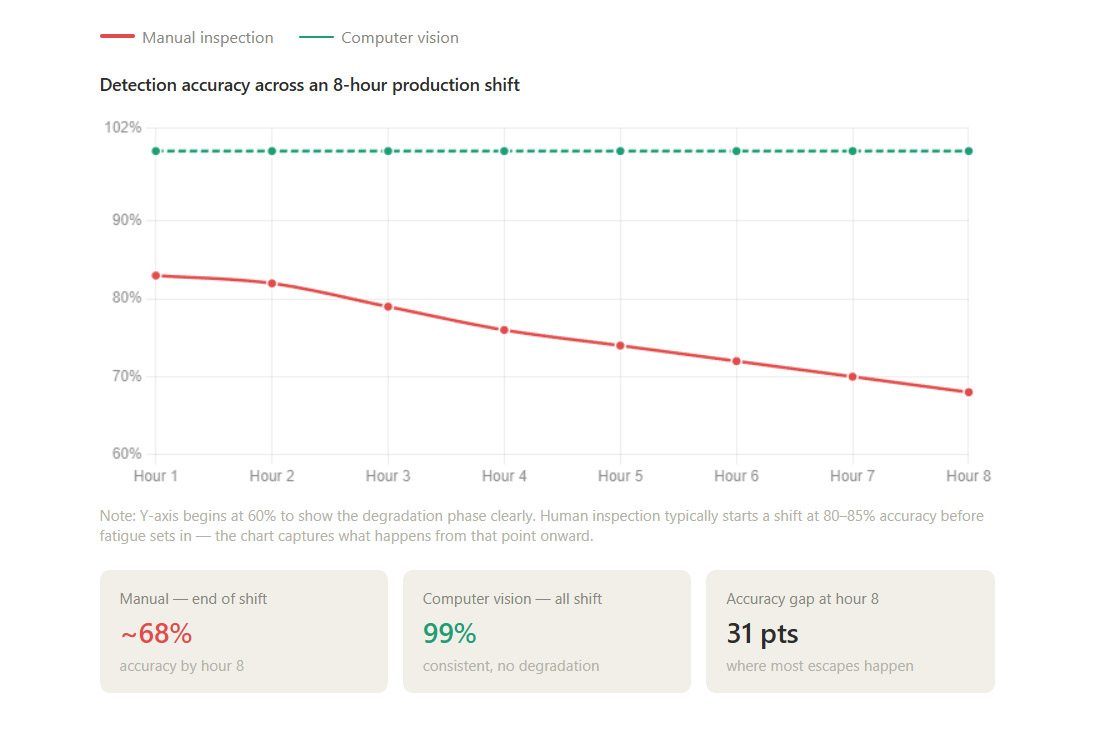
By the end of a long shift, inspectors were slowing down while the line wasn’t. That gap – between what the production rate demands and what a fatigued inspector can reliably deliver – is where escapes happen.
The defects that escape aren’t free. Quality management has a principle called the Rule of Ten: a defect caught at the inspection stage costs roughly 1x to resolve. The same defect caught at rework costs 10x. If it reaches a warranty claim, the multiplier is 100x. In automotive manufacturing, warranty claims frequently exceed $150 per incident, ranging significantly higher depending on part criticality. At scale, a 2-3% reduction in defect escape rate can outweigh total inspection labor costs. That number almost never appears on the labor report.
Then there’s throughput. A manual inspection station that requires one minute per part doesn’t just cost inspector wages – it sets a ceiling on how fast the entire line can move. When inspection is the slowest step, overall equipment effectiveness drops. Adding an automated vision cell running at seconds per part doesn’t just change the inspection cost. It changes the throughput math for the whole line.
None of this is visible in a headcount comparison. It lives in rework budgets, warranty reserves, and OEE reports. Industry research puts the cost of poor quality at 15-20% of a typical manufacturer’s annual sales revenue, with the visible expenses – scrapped material, overtime for rework, expedited shipping – representing only a fraction of the true cost. The rest sits below the surface: eroded customer confidence, and capacity tied up fixing problems instead of filling orders. Once you start looking for it, the labor line stops being the main number.
The custom computer vision deployment described in this case study achieved results that no off-the-shelf platform could match – because it was built for this specific production line, these specific defects, and this specific environment. For manufacturers wondering whether custom development is worth the investment compared to turnkey platforms, we’ve published a detailed comparison of custom builds vs off-the-shelf AI QC tools with honest cost and capability tradeoffs.
Computer Vision in Manufacturing: What One Deployment Actually Delivered
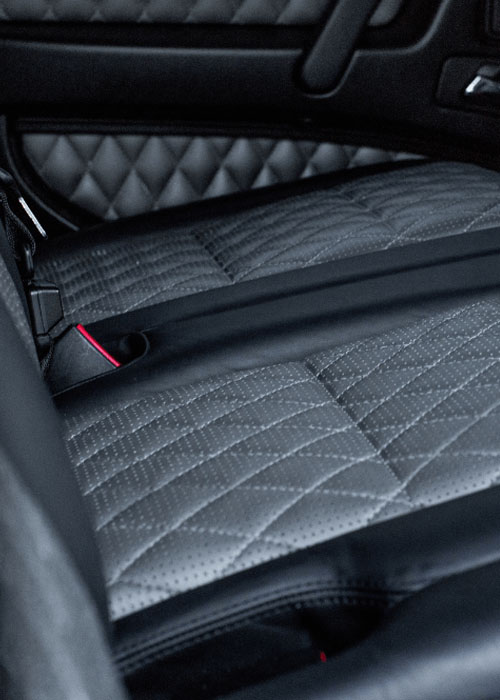
The client manufactures thousands of automotive seats daily across more than 40 models – varied materials, textures, and finishes. The quality problem was subtle: wrinkles and surface imperfections that human inspection was catching inconsistently, particularly toward the end of extended shifts. The inspection station was running at one minute per part and acting as a bottleneck across multiple production lines.
We deployed Seat Checker, a computer vision system built on deep learning models trained specifically for this production environment. The results after deployment:
- Inspection time per part: from approximately 1 minute to 2.2 seconds
- Detection accuracy: 99%, consistent across all 40+ models
- Cost savings vs. manual process: approximately 30x
At runtime – the point where the system is operating on the production floor – it handles the full model range without manual recalibration between variants. It adapts to different materials and finishes without human intervention between runs. Performance doesn’t degrade across shifts.
What that description leaves out is everything that happened before runtime. That part matters if you’re trying to understand whether these results are replicable in your environment.
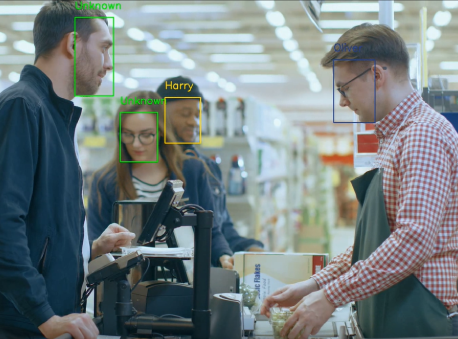
See how Agmis deployed AI-powered defect detection for one of the world's largest automotive seat producers, using computer vision to identify wrinkles and surface imperfections in real-time.
We’ve also compiled real cases showing how computer vision performs in production environments across multiple industries.
Breaking Down the 30x
The 27x speed improvement is arithmetic: 60 seconds divided by 2.2 seconds. A direct comparison between two inspection processes on the same line, under the same production conditions.
The 30x cost savings is different. It isn’t a single measurable variable – it’s the client’s assessment of total cost impact across three things that interact: inspection labor freed at scale, throughput recovered from removing the bottleneck, and reduction in defect escape costs downstream.
The labor component alone gives a sense of the scale. A line running 1,000 units per shift with one-minute manual inspection per part spends roughly 17 person-hours per shift on inspection. At 2.2 seconds per part, that drops to under 40 minutes. Significant, but in this deployment it was the smaller part of the savings.
The larger number was defect escape cost. Moving from inconsistent human inspection – with its 80% baseline accuracy and end-of-shift fatigue curve – to 99% consistent automated detection changes where defects are caught. Applying the Rule of Ten to even a modest reduction in escape rate compounds quickly at production volume. Read more about the path to 99% defect detection accuracy in manufacturing environments.
The variables that determine where your number lands: inspection labor cost per unit at your volume, your current defect escape rate and what resolving those defects costs downstream, and how much throughput is currently being suppressed by the inspection bottleneck.
The 30x is what this client documented, in their specific environment. Your number depends on your variables – and working those out before a vendor conversation is worth more than any figure this post can offer.
What It Actually Takes to Get There
This is the section that tends to be missing from vendor content. The Seat Checker system adapts autonomously at runtime. Getting it to that point was not autonomous.
Before the system could detect defects reliably, someone had to define what a defect actually looks like – across 40+ seat models, multiple material types, varying lighting conditions, and the full range of imperfection severity from clearly unacceptable to borderline. That work requires domain expertise. It can’t be done by a data scientist working from a spec sheet. Senior quality engineers and line technicians who know the product have to be involved in labeling training data, because they’re the ones who know which surface irregularity is a defect and which is within tolerance.
1
Domain definition
Quality experts define what a defect actually looks like across all product variants — before a single image is labeled.
2
Data labeling
Approximately 100 hours of expert time spent tagging 5,000+ representative images across materials, lighting conditions, and defect types.
3
Integration
Connecting the vision cell to existing PLCs and MES platforms — often the step that extends timelines when legacy systems are involved.
4
Optimization
Monitoring for model drift and lighting changes post-launch. A system at 99% on day one needs ongoing maintenance to stay there.
For a dataset of around 5,000 images – a reasonable starting point for a deployment of this complexity. Then there’s model training, validation against known defect samples, and iteration before anything goes near a production line.
After go-live, the work isn’t finished. Models drift. Lighting changes as bulbs age. New material variants get introduced. A system that’s at 99% on day one needs monitoring and periodic retraining to stay there. That ongoing maintenance cost is modest relative to the savings, but leaving it out of an ROI model produces a number that won’t survive contact with finance.
When Is Computer Vision ROI Highest in Manufacturing?
| Production environment | ROI potential | Primary driver |
|---|---|---|
| High volume / bottleneck | Maximum | Unlocks line speed; scales without headcount. |
| High value / critical part | High | Prevents 100x warranty and recall costs. |
| Low volume / high variety | Moderate / low | High upfront labeling cost vs. manual labor. |
| Invisible / structural defects | None | Requires X-ray or ultrasound, not cameras. |
Computer vision ROI in manufacturing is highest when two conditions exist together: high production volume where inspection creates a measurable throughput constraint, and meaningful downstream costs when defects escape. When both are present, the savings compound across labor, throughput, and defect escape simultaneously. With only one, the business case is thinner. With neither, it usually isn’t the right investment.
Strong conditions: High-volume lines where inspection is a measurable throughput constraint. If one-minute manual inspection sits inside a cycle time that matters, removing it has compounding impact across the whole line. The Seat Checker deployment is the clearest example – thousands of units daily, inspection as a genuine bottleneck, 40+ variants requiring consistent standards.
Strong conditions: Environments where defect escape costs downstream are significant. The higher your product value and the further downstream defects travel before being caught, the more the Rule of Ten works in favor of automated detection at source.
Weaker conditions: Low-volume, high-variability production. Without sufficient training data from your actual production environment – covering your specific defect types, materials, and lighting – the system won’t reach reliable accuracy. If you’re running 50 units a month across constantly changing configurations, the upfront labeling and training investment may not recover within a reasonable timeframe.
Weaker conditions: Defect types that require something other than visual detection. Computer vision identifies what a camera can see. If the quality problem is material density, structural integrity, or a defect that’s invisible on the surface, this isn’t the right tool regardless of what the accuracy benchmarks say.
The honest ROI conversation starts by establishing which category your production environment sits in. That should happen before anyone opens a proposal.
Not sure how to compare systems? Here’s a guide on how to evaluate AI quality control vendors before you commit.
What the Standard Business Case Gets Wrong
Most internally-built business cases for quality control automation focus on cost reduction at current volume. That’s the right starting point. It misses two things that tend to matter more over a three-to-five year horizon.
The first is scale without headcount. Manual inspection scales linearly – more volume means more inspectors. Automated inspection doesn’t follow that curve. When a new product line gets added, the vision system handles additional variants without additional inspection staff. That avoided hiring cost doesn’t appear in most ROI models, but it compounds.
Automated inspection does more than catch defects – it creates a systematic record of where quality problems originate. This data feeds supplier conversations and process adjustments that manual inspection simply cannot track.
The second is data. Every automated inspection generates a record: defect type, location, time of day, production line, material batch. Over time that becomes something manual inspection can never produce – a systematic view of where quality problems originate. That feeds supplier conversations, process adjustments, and production decisions that have nothing to do with inspection speed. It’s a different class of value, and it tends to be why deployments keep paying back years after the initial investment recovered.
A third thing gets left out consistently: the ongoing cost of running the system. Model retraining, data governance, handling false rejects, lighting maintenance. Modest relative to the savings, but including them makes the business case more credible to finance – which is usually the audience that matters most.
What Changes When the Bottleneck Disappears
The speed and accuracy improvements are the obvious part of the business case. What’s harder to put in a spreadsheet is what becomes possible when inspection stops being a constraint entirely.
Manual inspection at production scale is a tax on growth. Every new product line, every volume increase, every new market adds inspection headcount to the cost structure. That relationship is so assumed in manufacturing that most organizations have stopped questioning it.
Computer vision in manufacturing doesn’t just make inspection cheaper. It decouples inspection cost from production volume. A system handling 40 seat models handles 50 without a proportional cost increase. That’s a different kind of value than labor savings – it’s a structural change in how quality scales.
That shift doesn’t happen automatically, and it doesn’t happen cheaply upfront. But it’s the reason deployments that look marginal on a two-year ROI model tend to look very different on a five-year one.
Get a free consultation on software development, process automation, or AI-powered solutions — no commitment required.
Our senior consultants will review your goals, challenges, and opportunities, and outline the most effective next steps for your business.