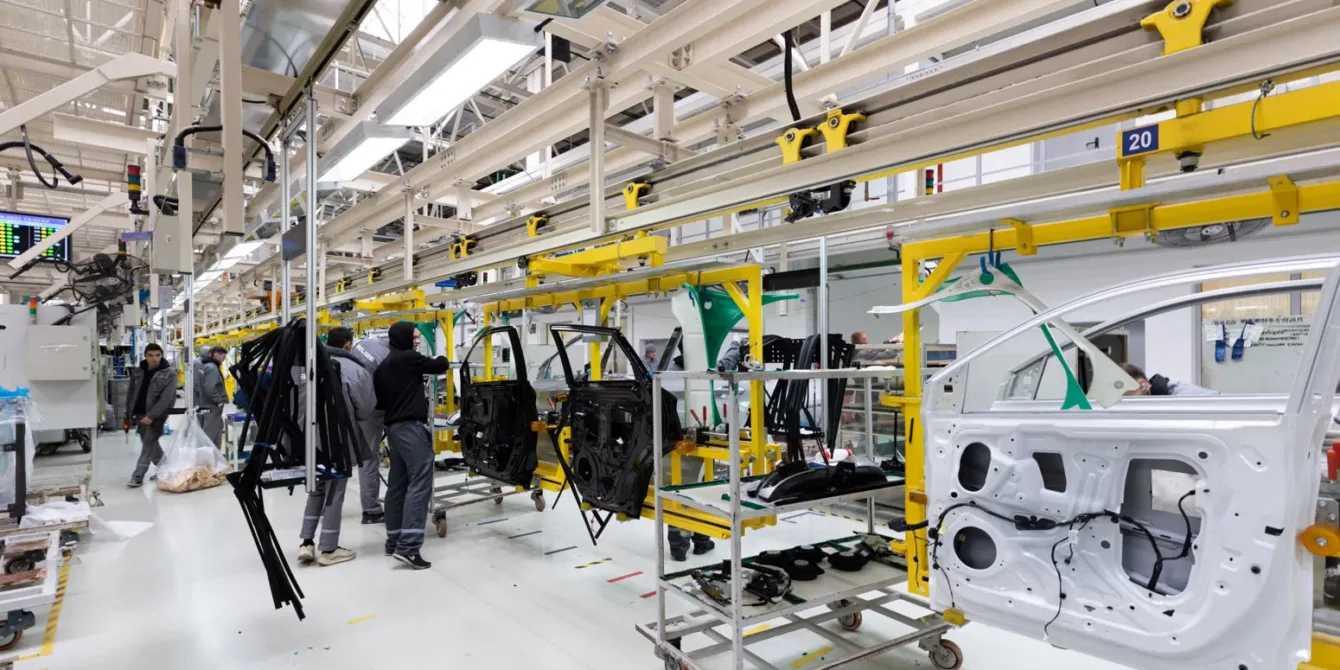


Idle workstation logging is the metric most plants don’t know they’re missing. A line can look fully utilized on paper – machines running, operators assigned, shifts covered. Walk the floor and the picture shifts. Stations sit empty while upstream work trickles in. Operators wait on material that hasn’t arrived. A packing cell runs at half speed because the label printer upstream jammed twenty minutes ago. None of this appears in machine uptime reports, and none of it is captured by traditional productivity tools.
This guide covers why idle time hides in plain sight, what it costs in concrete terms, and how a camera-based approach – idle workstation logging powered by computer vision – turns a qualitative hunch into a metric a team can act on.
What Idle Workstation Logging Actually Measures
Idle workstation logging continuously records the status of a defined workstation, work cell, or equipment zone: active or idle. The critical difference from machine monitoring is what it captures. Machine telemetry reports whether equipment is running. Idle workstation logging reports whether productive work is actually happening at the station – operator presence, hand and tool movement, material flow in and out.
That distinction matters because the expensive kind of idle time usually involves equipment that is technically “up.” A CNC machine in cycle while the operator waits for the next job is not idle by machine standards – but the station is staffed without producing. In lean terms, this is one of the Six Big Losses: idling and minor stops, the performance loss that quietly eats OEE. The machine looks busy. The output says otherwise.
Three Types of Idle Time (Only One Is an Employee Problem)
Most writing on this topic treats “idle time” as one thing. On a factory floor, it is three:
Conflating the three produces bad decisions. A manager who treats workstation idle as employee idle will blame operators for a scheduling problem. Measure the right thing first; the data will do the rest.
What Idle Time Costs: The Math That Changes the Conversation
Idle time in manufacturing is routinely dismissed as “normal.” The numbers say otherwise. According to Siemens’ True Cost of Downtime research, unplanned downtime now costs the world’s 500 largest manufacturers 11% of yearly turnover – roughly $1.4 trillion annually, or $129 million per facility. In automotive, an idle production line at a large plant costs about $695 million a year. Those are machine-down numbers. Workstation-level idle – stations staffed but not producing – sits on top of them, largely unmeasured.
$450
per station / per day
A single station idle 45 minutes per shift, at a fully loaded cost of $10 per minute, loses $450 per day. Twenty stations across two shifts: $18,000 a day – more than $4.5 million a year. The number only holds if the idle time is real and recoverable, which is exactly what logging turns from guesswork into fact.
Idle time also distorts the metrics lean teams rely on. Takt time assumes work arrives at a predictable rate. When stations starve upstream or buffer downstream, actual cycle times drift from plan and line balancing becomes guesswork. A line that cannot be seen cannot be balanced.
There is a human cost on top of the financial one. Idle bouts fragment attention, and the research on interruptions is unforgiving: the widely cited work of Gloria Mark’s team at UC Irvine suggests it takes roughly 23 minutes to return to a task after a single interruption. A station that stops and starts all day doesn’t just lose the idle minutes – it loses the recovery time around each one.
Why Current Tools Miss It
The result: plants run on anecdotes where they should run on numbers.
How Vision-Based Idle Workstation Logging Works
A camera-based system observes a defined zone and classifies it: active or idle. Computer vision platforms such as viso.ai’s work/idle logging application document this pattern as a standard manufacturing use case. The setup has four stages:
Zone mapping
Each workstation, cell, or machine area is defined in the camera frame – manual assembly stations, packing lines, inspection cells, robotic work cells, anything with a physical boundary.
Activity detection
A computer vision model detects human presence, motion, tool use, and material interaction inside the zone. If nothing registers for a configurable threshold (say, three minutes), the station is marked idle.
Time logging
Status is recorded continuously, then aggregated into idle minutes per shift, idle event counts, and duration patterns – the raw material for the metrics below.
Alerts and investigation
When idle time crosses a preset threshold, supervisors get notified during the shift, not after it. The intervention happens while the cause is still visible.
Because the approach reuses existing camera infrastructure and edge processing, deployment is fast and unobtrusive: no sensors on machines, no PLC integration, no disruption to operators. The same kind of vision infrastructure that cut a real inspection cycle from 1 minute to 2.2 seconds in production can be pointed at workstation utilization.
What to Measure (and What the Numbers Mean)
The core metric is idle minutes per day – the time a station was staffed but not productive. For reporting, the standard calculation is:
Idle time = scheduled working time – productive time
Idle time rate = idle minutes ÷ scheduled minutes
Around the core metric, build the pattern metrics that actually drive decisions:
The measurement philosophy matters more than the tool: the goal is not zero idle time. That is a burnout recipe, and in manufacturing it is not even achievable. The goal is appropriate idle time, calibrated to the line, the shift, and the role – exactly the principle behind choosing the metrics that match the operational decision when evaluating any AI system in production.
Vision Logging vs. Software Tracking: Which Fits Where
| Vision-based logging | Input-based software tracking | |
|---|---|---|
| What it measures | Physical activity at a station | Keyboard, mouse, scroll, app usage |
| Best for | Shop floor, warehouses, labs, physical work | Desk work, remote teams, digital workflows |
| Data collected | Presence/motion status, anonymized, edge-only | Input events, app usage, sometimes screenshots |
| Blind spot | What happens inside a screen | Physical work away from a keyboard |
| Deployment | Existing cameras, edge processing | Software agent on each endpoint |
The two are complements, not rivals. A hybrid setup – vision for the floor, software for the office – gives a factory a single view of productive time across every work type. Knowing where capacity actually sits is what makes production planning real: Agmis’s OptimusPlan already turns fragmented planning data into schedules 97% faster – idle logging gives that class of system the utilization truth it was missing.
Privacy and Compliance: The Part Most Guides Skip
The legitimate concern with any monitoring is privacy. The difference between logging and surveillance is what the system records. Vision-based idle logging records a status – active or idle – not identity, not video history, not what the person was doing. Data stays at the edge and is aggregated into pattern metrics. That is materially different from screen recording or continuous video review.
In the EU, GDPR applies to any processing of worker data, and regulators publish detailed monitoring guidance (the UK’s ICO is the most thorough). The requirements are practical: inform employees what is collected and why, keep it proportionate, delete what is not needed. The pattern that works in practice: measure stations, not people; publish the policy; show employees their own data.
Transparency is not just compliance – it is the difference between a tool and a weapon. Gallup’s State of the Global Workplace shows why this matters right now: global employee engagement fell to 21% in 2024, the lowest level since 2020. Monitoring deployed without trust accelerates disengagement. Monitoring deployed transparently is just another instrument panel.
From Pilot to Production
1
Pick one line or cell. Map five to ten stations. Log for two weeks before changing anything – the baseline is the deliverable.
2
Show the data to the line supervisor and the team. Let people react to their own numbers before anyone else does.
3
Fix the two or three biggest structural causes the data exposes – usually material flow, handover timing, or scheduling.
4
Re-measure. The before/after gap is the ROI story, and it justifies expanding to the rest of the facility.
This mirrors how production-grade computer vision projects actually roll out – small scope, a real operational problem, a measured result. Agmis has built and deployed vision systems across manufacturing environments – inspection lines, PPE safety monitoring, production planning – and idle workstation logging follows the same playbook: existing cameras, edge processing, a metric that did not exist before, and a decision that can now be made from data. The same measured-baseline logic underpins any vision investment – our guide to computer vision ROI in manufacturing shows how to quantify it before you commit.
The Bottom Line
Idle time is not an employee problem. It is an information problem. The stations were idle all along; the plant just had no way to see it. Idle workstation logging adds the missing data layer: a continuous, objective record of when work is happening and when it is not. Once the number exists, everything downstream improves – OEE discussions get honest, line balancing gets grounded, and capital decisions stop being defended with anecdotes.
The plants that measure idle time will find the hours their competitors are paying for twice – once in wages, once in lost output. That asymmetry is the whole business case.
Get a clear path forward.
Share your challenge and walk away with concrete next steps - whether you're exploring AI, automating a process, or scoping a custom software project.
- Honest assessment of your situation - no sales pitch
- Actionable next steps you can use right away
- AI, automation, and custom software expertise