Store-level metrics like sales per square foot tell you that revenue is down. They don’t tell you why. In most cases, the answer is on the shelf – or more precisely, not on it. Industry data suggests out-of-stocks cost retailers 4-8% of total sales annually, and nearly 70% of those gaps originate inside the store itself, not in the supply chain. In our deployment with one of Central and Eastern Europe’s largest retailers, computer vision monitoring reduced cashier idle time by 57.66% and prevented 237 queue incidents – using cameras already installed in the ceiling. The same technology now monitors shelf availability in real time. Here’s what actually works.
Key Takeaways:
Out-of-stocks cost retailers 4-8% of annual sales – and ~70% of them happen inside the store, not in the supply chain
Computer vision transforms existing CCTV cameras into real-time shelf monitoring – zero additional hardware per store
In our retail deployment: 57.66% cashier idle time reduction, 237 queue incidents prevented, 2.5 hours saved per store daily
Honest limitation: computer vision monitors what cameras can see – aisle blind spots and backroom inventory still need traditional tracking
Why Store-Level Metrics Hide the Real Problem
Sales per square foot, average transaction value, year-over-year growth – these are the metrics retail managers live by. And they’re useful for benchmarking one store against another. But they share a fundamental limitation: they’re aggregated at the store level, which means they tell you what happened without telling you where it happened.
If sales are down 3% this month, is it a pricing issue? A staffing problem? A product mix that doesn’t match local demand? Or is it the simplest explanation – products that customers wanted to buy weren’t on the shelf when they walked through the aisle?
Store-level data can’t distinguish between these causes. It treats an empty shelf and a well-stocked one identically, as long as the net sales number is the same. For a manager trying to figure out what to fix, that’s like diagnosing a patient by taking their temperature and nothing else.
The metric that actually closes this gap is On-Shelf Availability (OSA) – the percentage of time a product is present, visible, and purchasable at its designated shelf location. Not “in stock somewhere in the building.” On the shelf, where the customer expects to find it.
The Invisible Problem: Phantom Inventory and the “Last 100 Feet”
The most frustrating variant of an out-of-stock is phantom inventory – when the system says you have 24 units, but the shelf is empty. The product exists in the building. It’s sitting in a delivery cage, trapped behind a pallet in the backroom, or misplaced three aisles over. For the customer staring at the gap, it doesn’t matter. The product is unavailable.
Phantom inventory is invisible to traditional inventory management systems because those systems track what’s been received and what’s been sold. They don’t track what’s actually on the shelf right now. That gap between the system’s count and physical reality is where revenue disappears.
Nearly 70% of out-of-stock events originate inside the store – not in the supply chain. The product made it to the building. It just didn’t make it to the shelf in time. This is the “last 100 feet” problem, and it’s where most retail revenue leaks occur.
The downstream costs compound quickly. Industry estimates place the annual revenue impact of out-of-stocks at 4-8% of total sales. For a mid-sized grocery chain, that’s millions. But the damage goes beyond immediate lost transactions. Repeated stockouts erode shopper trust – a customer who can’t find what they came for once might switch brands. If it happens again, they switch stores.
Why Manual Audits and POS Data Aren’t Enough
Traditional shelf monitoring methods are fundamentally reactive – they identify problems after they’ve already cost you sales. Each approach has specific limitations that make real-time shelf management nearly impossible.
1
Manual audits and cycle counts
Labor-intensive, prone to human error, and provide only a snapshot. By the time the report reaches the manager, the data is already stale. In busy periods, these audits are often delayed or skipped entirely.
2
POS data analysis
POS data tells you what sold. It’s a lagging indicator – by the time zero-sale trends are identified, the shelf has been empty for hours. It also can’t distinguish between “nobody wanted this product” and “nobody could find this product.”
3
Field team and merchandiser reports
Valuable on-the-ground intelligence, but infrequent and unscalable. A store might look perfect during a scheduled visit and struggle for the remaining six days. These reports can’t provide the continuous coverage needed for real-time shelf health.
The common thread: none of these methods provide continuous, real-time visibility into what’s actually happening on the shelf. They perpetuate a reactive cycle where teams are always responding to problems that have already impacted sales.
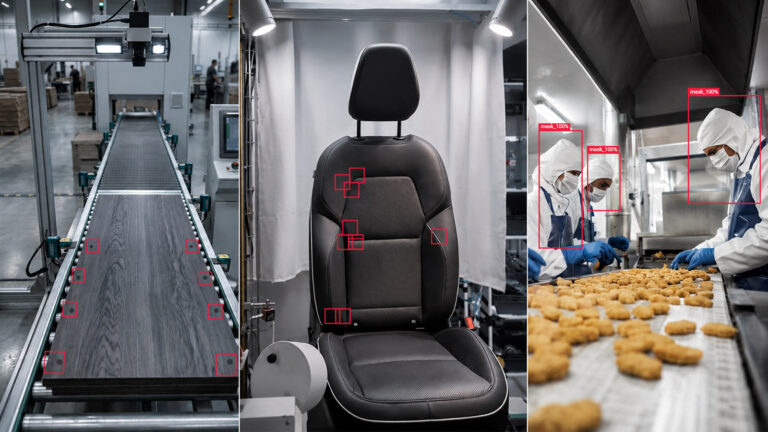
Computer Vision: Turning Existing Cameras into Shelf Intelligence
Computer vision transforms a retailer’s existing CCTV infrastructure – cameras already installed for security – into a continuous, AI-powered shelf monitoring system. No new hardware per store. No sensors on shelves. The same cameras that watch for theft now watch for empty spaces.
The process is straightforward:
| Step | What happens | Why it matters |
|---|---|---|
| Data capture | In-store cameras capture continuous video of shelf areas | No additional hardware investment required |
| AI analysis | Machine learning models identify products, detect empty spaces, verify planogram compliance, and check pricing | Continuous monitoring vs. periodic snapshots |
| Real-time alerts | When stock drops below threshold, instant alerts go to floor associates’ mobile devices | Staff are guided to problems, not searching for them |
| Insights and reporting | Dashboard provides shelf health data, restocking patterns, and compliance reports | Feeds demand forecasting and supplier conversations |
This creates a closed-loop system. Instead of a manager walking the floor hoping to spot gaps, the floor tells the manager where the gaps are. Associates stop searching for problems and start solving them. The shift from reactive to proactive changes the economics of shelf management entirely.
For a deeper look at how this technology addresses on-shelf availability specifically, we wrote a detailed breakdown of how computer vision improves on-shelf availability without additional staff or manual audits.
Beyond the Shelf: What the Same Infrastructure Enables
Once the computer vision platform is running, shelf availability monitoring is the starting point – not the ceiling. The same camera feeds and AI pipeline support a range of store operations that would otherwise require separate systems.
→
Planogram compliance
AI verifies that shelf layouts match corporate planograms automatically, flagging deviations without scheduled audits. This ensures brand consistency and optimizes product placement for maximum conversion.
→
Queue management
The same cameras monitor checkout areas, predicting queue formation before lines develop and alerting staff to open additional counters proactively.
→
Promotional execution verification
Confirm that promotional displays are set up correctly and on time. Correlate with POS data to measure actual sales lift and optimize future campaigns.
→
Demand forecasting input
Granular shelf-level data on sell-through speed provides a new input for demand forecasting that goes beyond historical POS data – accounting for in-store variables that traditional systems miss.
The underlying principle across all of these is the same: you already have the cameras. The investment is in the intelligence layer that makes them useful for operations, not just security.
Real-World Proof: The 57% Efficiency Gain
We applied this exact “predictive vs. reactive” approach for one of Central and Eastern Europe’s largest retail chains. The initial deployment focused on queue management – predicting checkout surges before lines formed – but the underlying technology and principle are identical to shelf monitoring: use existing cameras to detect problems before they impact customers.
| Metric | Before (traditional management) | After (AI-powered monitoring) |
|---|---|---|
| Cashier idle time | Baseline | 57.66% reduction |
| Queue incidents | Reactive – staff responds after queues form | 237 incidents prevented |
| Daily time savings | No measurable baseline | 2.5 hours per store |
| Hardware investment | N/A | Zero – existing cameras |
The key insight from this deployment: the retailer already had strong operational practices. They weren’t starting from chaos. But even their well-managed stores had recoverable efficiency – idle time that accumulated across counters and shifts, queue patterns that human supervisors couldn’t predict consistently. The AI didn’t replace good management. It gave good managers better data.
Whether it’s a queue at the checkout or a gap on the shelf, the principle is the same: detect the problem before the customer experiences it.
What Computer Vision Can’t Do (And What You Still Need)
Computer vision monitors what cameras can see. That’s a meaningful constraint worth understanding before evaluating any deployment.
Camera placement determines coverage. Aisles without camera angles are invisible to the system. Most retail stores have security cameras concentrated at entrances, checkouts, and high-theft zones – not necessarily optimized for every shelf section. Expanding coverage may require additional cameras, which changes the “zero hardware” equation.
Backroom inventory remains a separate problem. Computer vision tells you the shelf is empty. It doesn’t tell you whether replacement stock exists in the backroom or needs to be reordered. Integration with inventory management systems bridges this gap, but it’s an integration step that adds complexity.
Product recognition accuracy varies. Detecting a missing product on a well-organized shelf is relatively straightforward. Detecting a misplaced product – say, a competitor’s brand accidentally shelved in your product’s spot – is harder. Small, similar-looking items (different flavors of the same product line) still challenge current models, particularly at a distance.
It’s a tool, not a strategy. Real-time alerts are only valuable if someone acts on them. A system generating 200 alerts per shift in a store with three floor associates will create alert fatigue, not better availability. Threshold tuning, prioritization logic, and staffing alignment all need to be part of the deployment plan.
Implementation: What It Actually Takes
Deploying shelf analytics isn’t a plug-and-play exercise, even when leveraging existing cameras. The technology works, but the deployment succeeds or fails on the operational decisions around it.
Camera audit comes first. Before any AI model is trained, you need to know what your existing cameras can actually see. Coverage gaps, resolution limitations, and lighting conditions all affect what the system can detect. This audit determines whether additional cameras are needed and where.
Integration matters more than algorithms. The shelf alert is only useful if it reaches the right person with the right context. That means integrating with task management systems, mobile devices for floor staff, and ideally the inventory management system so alerts include restocking guidance, not just “shelf empty.”
Change management is half the project. Store associates need to understand that AI monitoring is a tool to make their work more targeted, not a surveillance system tracking their performance. Deployments that skip this step consistently face adoption resistance.
Start with one store, one category. Pilot with a high-traffic category in a single location. Validate the accuracy, measure the response time improvements, and work through the operational kinks before scaling to the full chain. Agmis retail deployments typically follow this approach – the queue management pilot ran for two months before the retailer had the data to justify wider rollout.
Moving from Store-Level to Shelf-Level Precision
The shift from tracking store performance to tracking shelf performance is more than a technology upgrade. It’s a change in how retail managers think about their data.
Store-level metrics aggregate everything into a single number. Shelf-level analytics decompose that number into its causes. When sales are down, you stop guessing and start seeing – is it a pricing issue in aisle 7, a persistent stockout on your highest-margin product, or a planogram deviation that’s hiding a promotion?
The retailers who are making this shift aren’t necessarily the ones with the biggest technology budgets. They’re the ones who recognized that the cameras on their ceiling are an underutilized asset. The infrastructure already exists. The question is whether the intelligence layer on top of it exists too.
At Agmis, we build that intelligence layer. If you’re evaluating how computer vision could work with your existing store infrastructure, we’re happy to start with a camera coverage audit and show you what’s realistically achievable.
Frequently Asked Questions
Get a free consultation on software development, process automation, or AI-powered solutions — no commitment required.
Our senior consultants will review your goals, challenges, and opportunities, and outline the most effective next steps for your business.